[ Main page | About Your System | About Fuzzy Logic | The Importance of Explainability | Commercialising ]
I have built a simulation of dynamic pricing, showing how this can be controlled by an expert system. As explained on the main page, this is not yet a commercial product but an MVP — Minimum Viable Prototype. However, it demonstrates the principles, and could be scaled up to a commercial product. I have ensured that it needs no specialist knowledge to understand, so it should be easy for the government inspectors to understand and for you to explain to them. For further information about fuzzy logic and how the expert system works, please see About Fuzzy Logic . I explain these at a non-technical level on the current page.
To access the system, please go to https://expertsystemdemos.net/sim_dp.html . Do this on a laptop or desktop computer rather than a phone, as the simulation needs ample screen space for controls, charts, and diagnostics.
When you first load this page, you
will see a page with green buttons at
the top, and some largely empty boxes below.
It looks like this, though you may find
the buttons all fit on one row:
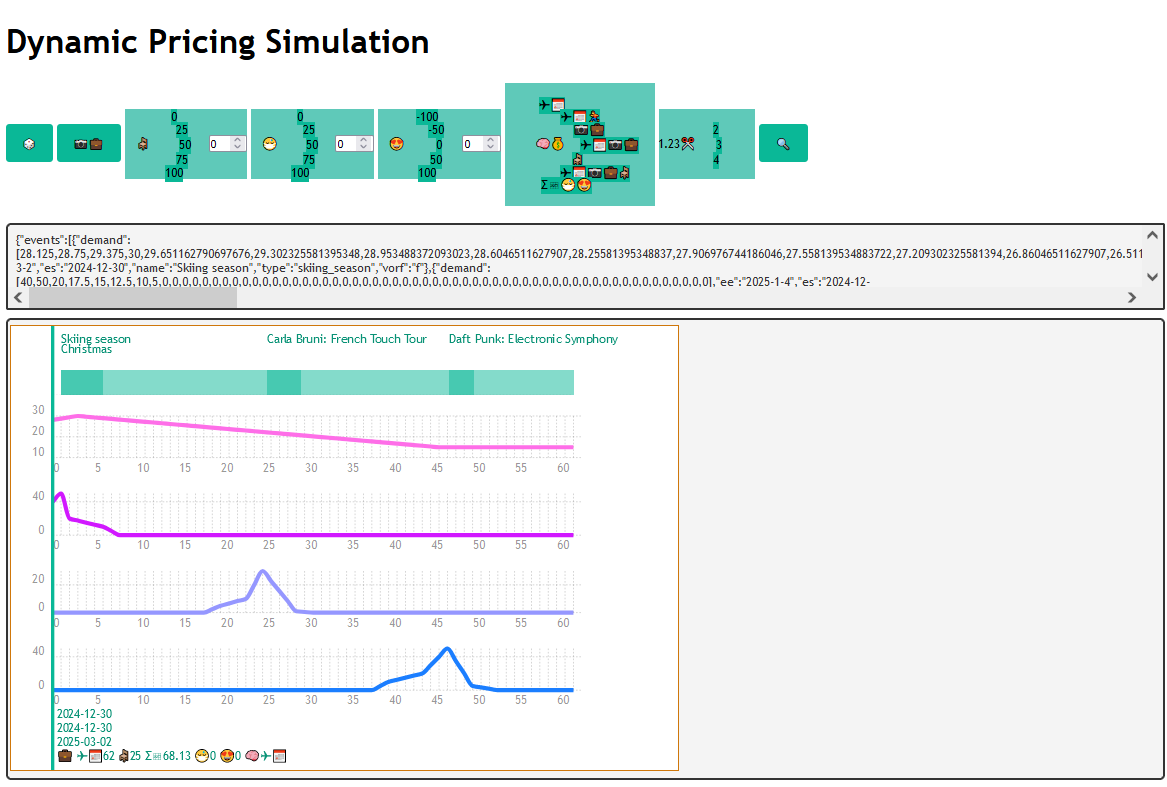
Pressing the button will put some programmerish-looking text into the box just below it. This is the data structure that holds a dynamic-pricing scenario, and is largely for the system developer.
Below it in the biggest box is a diagram of named mint-green blocks or strips, and at least one line graph. These show key features of the scenario.
The scenario concerns a prospective flyer looking at airline tickets from an airport in England to one in Germany. Because I know the regions, I have assumed a small rural English airport similar to Oxford Kidlington, and a larger tourist/business hub similar to — and near to — Munich. I've called the latter city Alpenstadt. This city hosts a variety of concerts, trade fairs and other events, including its own version, Alpenfest, of Munich's famous Oktoberfest beer festival. It also follows a conventional Western calendar, so has Easter and Christmas, including the religious days themselves plus a halo of days around them which people treat as holidays. Finally, being in the foothills of the Alps, it has a winter skiing season.
The flyer is assumed to start thinking about travel roughly two months — actually, 63 days or nine weeks — before departure. The price of their ticket will depend on Alpenstadt's events. So the simulator depicts these, as labelled blocks at the top of the box. The start and end dates of the period are shown at the top right of a mint-green vertical bar, initially positioned on the Y-axis at the left of the charts. Clicking and dragging it will move it across the box. A date between the start and end ones will update accordingly, showing the date where the bar currently stands.
Events may overlap. The blocks are translucent, so this will be obvious. Each label is left-aligned to its block, so you can always look down from the left of a label to see where its block begins.
Below the labelled blocks are one or more charts. These represent the demand due to each event. (Due to lack of space, if there are more than four events, only the first four get shown.) .......... demand increment/...?
The expert-system rules use three values as their inputs, explained in the next section. These are the market sector (business or tourist), the number of days before flight, and the total demand. The draggable bar shows these below the end date, using emoji to shorten the display. The first emoji is either a camera or a briefcase, and indicates tourist or business class. If you press the Tourist/Business button, you will see it change. The second group of symbols is days to flight, introduced by an airplane and a calendar. And the third group is total demand, introduced by a Sigma Σ and a graph emoji. Total demand is calculated by summing the points on all the individual demand lines that the bar passes through. I haven't implemented the complex coding needed to stop this text overlapping with event names, so you may sometimes find it gets tangled up in them. If that's a nuisance, just move the bar out of the way to read it, then back again.
..... screenshot...

Note that there are two
sets of rules: one about whether
to override normal policy, and
one about delivery timing. Note also
that every rule has a condition such
as weather is summer_good
and a conclusion such as
days_to_delivery is four_weekly.
Each condition gets tagged with a coloured number, which is repeated in brackets at the end of the rule.
The number measures how much the condition holds. It's like saying that I, at 6 foot 4 inches, am tall, whereas Eddie at 5 foot 10 inches, is only a bit tall. Or that my shoes, which are 11 in UK sizes, are large, whereas Eddie's, at 7, are average. There is no precise definition of "tall" or "large", and no cut-off point such that 6 foot 4 inches (say) is tall but 6 foot 3 inches is not. Similarly with weather. But we can say, a bit vaguely, that something is 10% tall or 70% big or 90% chilly, and that is what we are doing here. Behind the scenes, a rule-evaluator is handling all this, using fuzzy logic to ensure that these numbers get used in a consistent and mathematically respectable way.
Basically, this is a way of having lots of rules that forecast different aspects of a problem, working out how well each one fits the data, and then integrating all their advice, paying most attention to the rules that fit best. Technically speaking, this is Mamdani fuzzy logic, and is a well-understood part of artificial intelligence, covered in all textbooks. The underlying maths has been around since the 1960s, when it was invented by Lotfi Zadeh. Web searches for topics such as "fuzzy-logic controllers" will find many examples of real- world use: a favourite one is fuzzy control of fans and washing-machines. For more information, see About Fuzzy Logic , especially the shoe-size system demo.
In expert-systems terminology, a
knowledge base is the collection of rules and
other infrastructure that contains the
expert knowledge being consulted. Our
knowledge base is shown below, and contains the rules
seen above plus
their fuzzy sets. Most of
the set membership functions
are triangular, with one or two ascending
and descending. If you remember that
the numbers in the tri,
up and down
structures are positions on the relevant measurement
scale — weather severity, delivery delay, customer
stock loss, or priority — then their meaning should be clear.
Consult the page on fuzzy logic for more info.
As noted in the last section, there are two lots of rules. The priority rules run first. If they decide on an immediate override, then the second lot will either not run, or will run but be ignored. Instead, the logistics manager will queue a request for immediate delivery. Otherwise, the delivery schedule calculated by the second lot of rules will be used.
if weather be summer_good then
   days_to_delivery := four_weekly.

if weather be summer_poor then
   days_to_delivery := three_weekly.

if weather be winter_ok then
   days_to_delivery := two_weekly.

if weather be winter_chill then
   days_to_delivery := weekly.

if customer_spoilage be spoilage_small then
  priority := follow_standard_procedure.

if customer_spoilage be spoilage_big then
  priority := override.

low( weather, 1 ).
high( weather, 10 ).
scale( weather, '1-10' ).
fuzzy_set( weather, winter_chill, tri( 1, 2.5, 5 ) ).
fuzzy_set( weather, winter_ok   , tri( 3, 4.5, 6 ) ).
fuzzy_set( weather, summer_poor , tri( 5, 6.5, 8 ) ).
fuzzy_set( weather, summer_good , tri( 7, 8.5, 10 ) ).
% Step sets by 2.

low( days_to_delivery, 0 ).
high( days_to_delivery, 35 ).
scale( days_to_delivery, 'Days' ).
fuzzy_set( days_to_delivery, immediate   , tri( 0, 1, 3 ) ).
fuzzy_set( days_to_delivery, weekly      , tri( 2.5, 7, 11.5 ) ).
fuzzy_set( days_to_delivery, two_weekly  , tri( 9.5, 14, 18.5 ) ).
fuzzy_set( days_to_delivery, three_weekly, tri( 16.5, 21, 25.5 ) ).
fuzzy_set( days_to_delivery, four_weekly , tri( 23.5, 28, 32.5 ) ).
% Step sets by 7, sides 4.5.

low( customer_spoilage, 0 ).
high( customer_spoilage, 400 ).
scale( customer_spoilage, 'Pounds' ).
fuzzy_set( customer_spoilage, spoilage_small , tri( 0, 2.5, 6 ) ).
fuzzy_set( customer_spoilage, spoilage_medium, tri( 4, 15, 20 ) ).
fuzzy_set( customer_spoilage, spoilage_big   , up( 15, 30, 400 ) ).

low( priority, 1 ).
high( priority, 10 ).
scale( priority, '1-10' ).
fuzzy_set( priority, follow_standard_procedure, down( 1, 6 ) ).
fuzzy_set( priority, override                 , up( 4, 10 ) ).
This is obviously simplified compared with real life. I chose a set of rules that was easy for you to explain, maintained stable stock levels over long periods, and was small enough that you could see the entire ruleset in a trace — i.e. in the logistics panel. Nevertheless, they demonstrate the principle, and could be scaled up to a full product.
Running the simulation a number of times will show that the rules maintain stability for quite a long time, without the customer's stocks either crashing to zero or overrunning the available storage space. You can see this in the screenshot shown earlier. It demonstrates, in a simple way, what your final product is to achieve for your customers.